
Archived Media Medic survey: American views on AI, jobs and elections
This archive preserves the three original graphics from Media Medic’s earlier article about attitudes toward artificial intelligence (AI). The percentages are claims reported in that publication, not independently verified estimates or results from a current poll. The original graphics are unchanged, with text transcriptions of the values printed in each.
Original scope of Media Medic’s AI survey
The original Media Medic article about artificial intelligence (AI) said it commissioned a survey of 6,000 respondents covering all 50 states. Each retained graphic instead states: “Survey of 6000 in US, 5612 responded based across all states.” The available materials do not explain the relationship between those two counts.
The archive preserves both statements without treating either as a verified sample description. The figures do not establish how many people answered each question in each state. A response rate or a margin of error cannot be established from these statements alone.
The three archived AI-survey graphics
The retained Media Medic graphics cover expected election interference, expected job loss and self-reported use of artificial intelligence (AI) to generate fake images or videos. Each graphic prints five state values. The graphics preserve the publication’s wording and reported percentages; their accompanying text transcribes those values without reconstructing a complete survey dataset.
Reported concern about AI and presidential elections
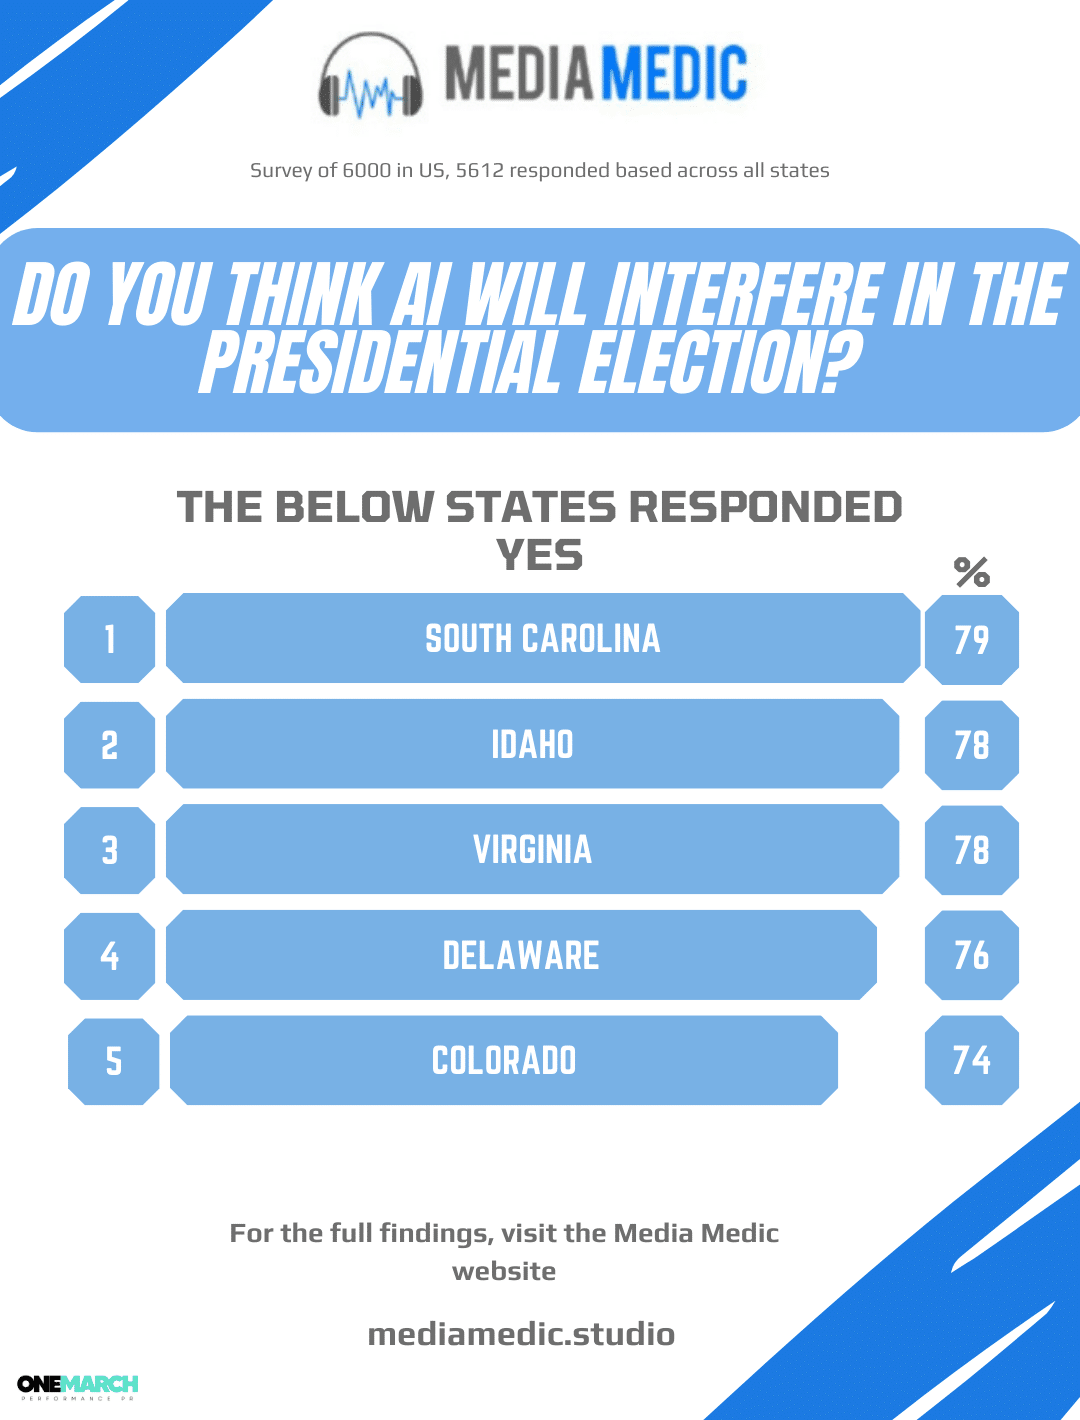
Media Medic’s original election graphic lists five states and percentages shown as answering “Yes” to whether artificial intelligence (AI) would interfere in the presidential election. These are reported expectations; they do not show that interference occurred.
 Open the original full-resolution graphic
Original election graphic, preserved unchanged. The table transcribes the printed values rather than recalculating the survey.
| State shown in the original graphic | Reported “Yes” percentage |
|---|---|
| South Carolina | 79% |
| Idaho | 78% |
| Virginia | 78% |
| Delaware | 76% |
| Colorado | 74% |
The state-level respondent counts and selection method are not supplied in the retained materials. These figures should not be treated as verified estimates of each state’s population or as a measure of actual election interference.
Reported concern about losing a job to AI
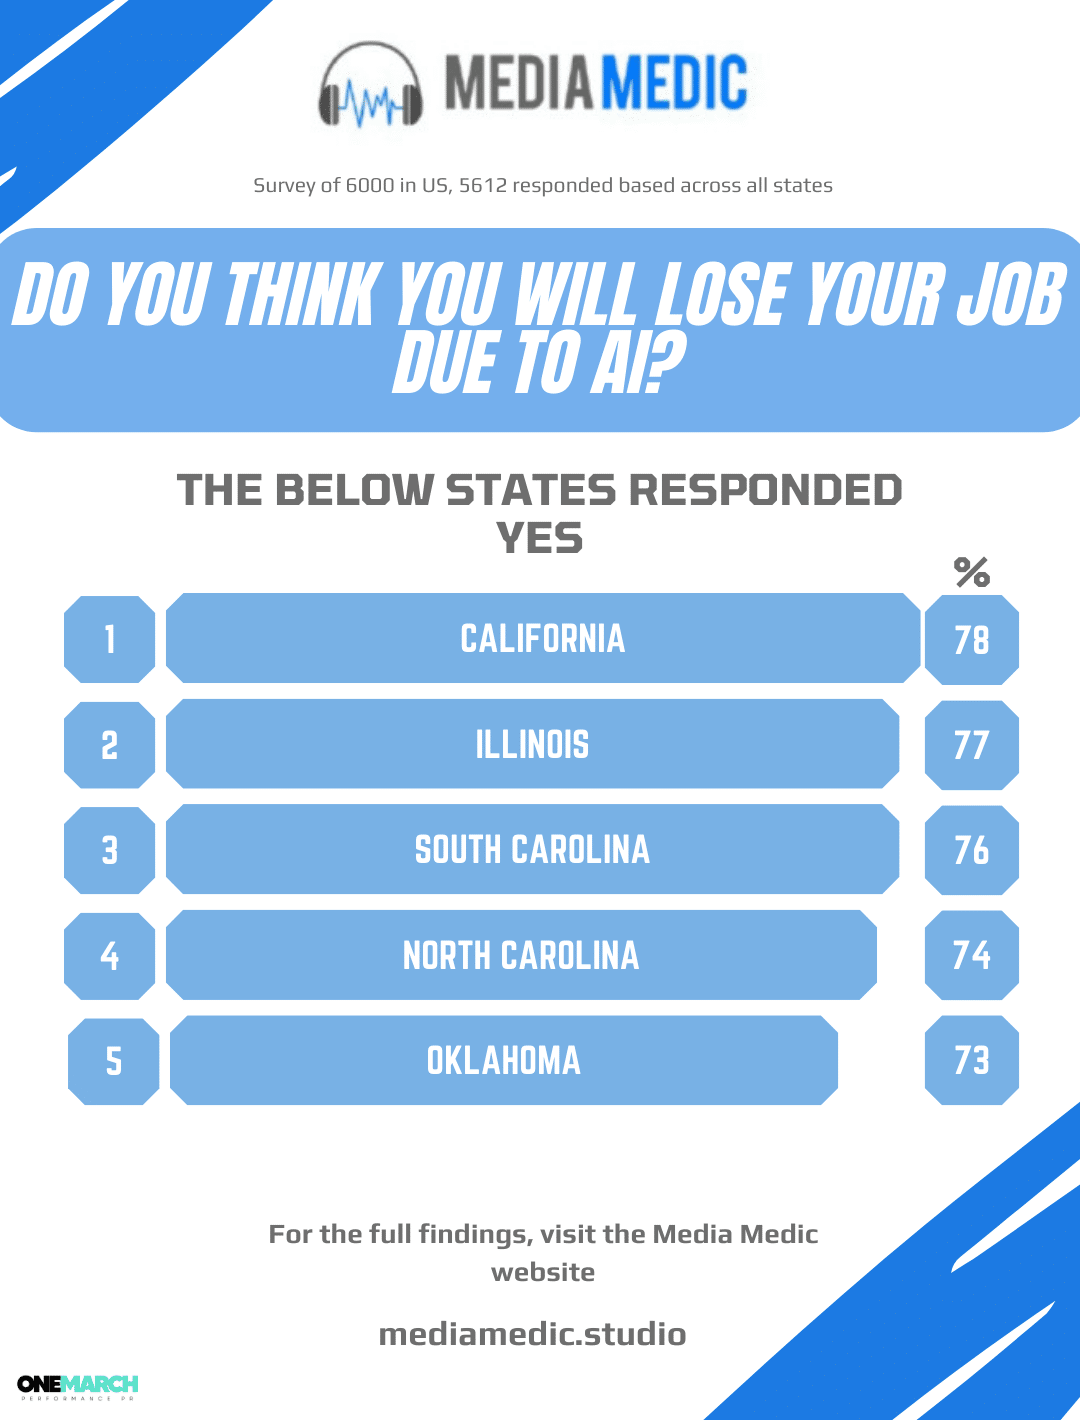
Media Medic’s original employment graphic lists five states and percentages shown as answering “Yes” to a question about losing a job because of artificial intelligence (AI). It reports an expectation about job loss, not observed employment outcomes.
 Open the original full-resolution graphic
Original employment graphic, preserved unchanged, including its original wording. The table transcribes its five printed values.
| State shown in the original graphic | Reported “Yes” percentage |
|---|---|
| California | 78% |
| Illinois | 77% |
| South Carolina | 76% |
| North Carolina | 74% |
| Oklahoma | 73% |
The retained materials do not provide the respondent counts needed to assess these state comparisons. The percentages do not establish the number of jobs lost to AI, future job losses or the reasons respondents gave their answers.
Reported use of AI to generate fake images or videos
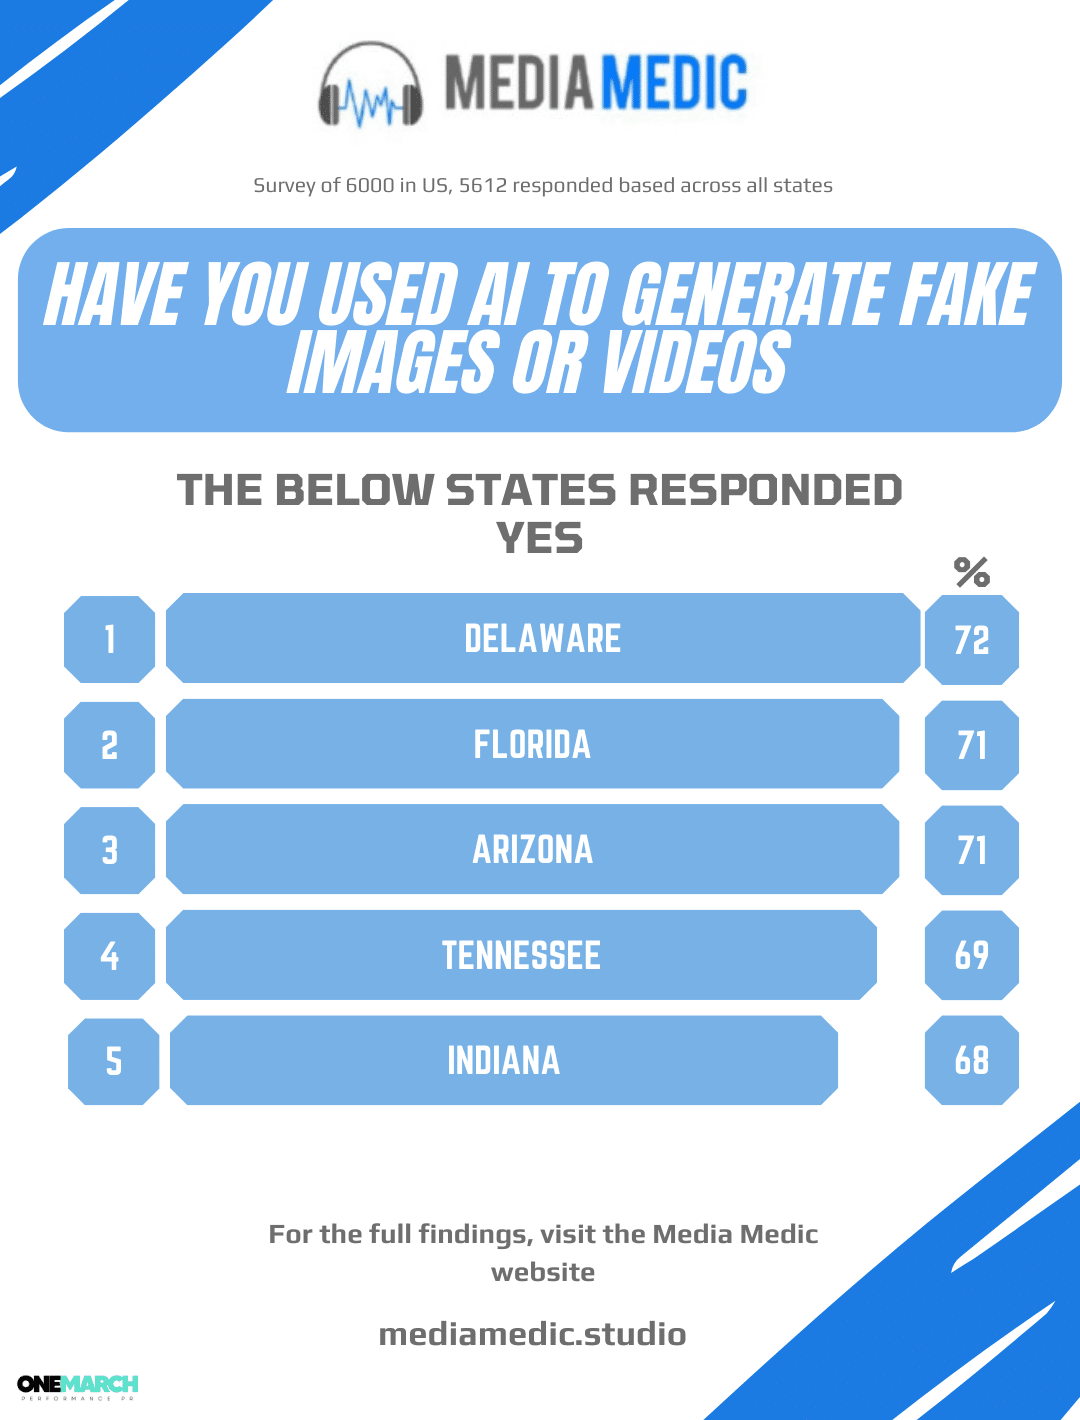
Media Medic’s original fake-content graphic lists five states and percentages shown as answering “Yes” to having used artificial intelligence (AI) to generate fake images or videos. These are reported survey answers, not independently verified accounts of what respondents created or why.
 Open the original full-resolution graphic
Original fake-content graphic, preserved unchanged. The table transcribes its five printed values.
| State shown in the original graphic | Reported “Yes” percentage |
|---|---|
| Delaware | 72% |
| Florida | 71% |
| Arizona | 71% |
| Tennessee | 69% |
| Indiana | 68% |
The retained materials do not define “fake” or establish whether the reported creations were deceptive, harmful, disclosed or fictional. These percentages should not be interpreted as verified rates of misconduct within a state.
Methodology limits and inconsistencies in the archived AI survey
Media Medic’s retained survey article about artificial intelligence (AI) and its graphics do not supply recruitment details, field dates, the complete questionnaire, per-state respondent counts, weighting procedures or a raw dataset. Without those materials, this archive cannot verify representativeness, reproduce the calculations or establish statistical uncertainty. The five states printed in each graphic are not a complete state-by-state dataset.
The original text also contains inconsistent claims about the lowest trust in AI for creating important content. Its key findings give Nebraska and Rhode Island as 34%, while a later section calls New Hampshire’s 35% the lowest. The available evidence does not resolve that inconsistency. This archive does not silently select one claim as the corrected result.
The original article’s explanations linking state responses to industries, politics or cultural attitudes are not established by the retained survey materials. Those explanations are not adopted here as findings.
Sources for the archived Media Medic AI survey
Media Medic’s original survey article about artificial intelligence (AI) appeared at /influence-of-ai/ under the heading “Survey – The Influence of AI on American Perceptions.” The archival source record includes the complete article capture retained on November 5, 2026 and the three original full-resolution graphics. That capture date is not a survey field date or a claimed original publication date.
A Techstrong article citing the Media Medic poll provides an example of an external reference to the original page. A citation demonstrates attribution; it does not independently validate the survey’s methods or results.
The archival record preserves what the original materials reported and makes their evidentiary limits explicit. It does not present a new poll, a current forecast or a measure of Media Medic’s restoration capabilities.